Google Lighthouse can help you spot technical problems that affect the quality of a webpage, but the score at the top of the report is only part of the story.
A Lighthouse audit can highlight performance bottlenecks, accessibility issues, browser best-practice problems and basic SEO concerns. The useful part is understanding what those findings mean and deciding which ones are actually worth fixing.
For WordPress site owners, Lighthouse is particularly useful when you want to investigate a slow page, check changes before and after an update, or identify technical issues that are easy to miss during normal browsing.
This guide explains how to run Lighthouse, interpret its results and turn the report into practical next steps without becoming fixated on achieving a perfect score.
What Is Google Lighthouse?
Google Lighthouse is an automated website auditing tool developed as an open-source project.
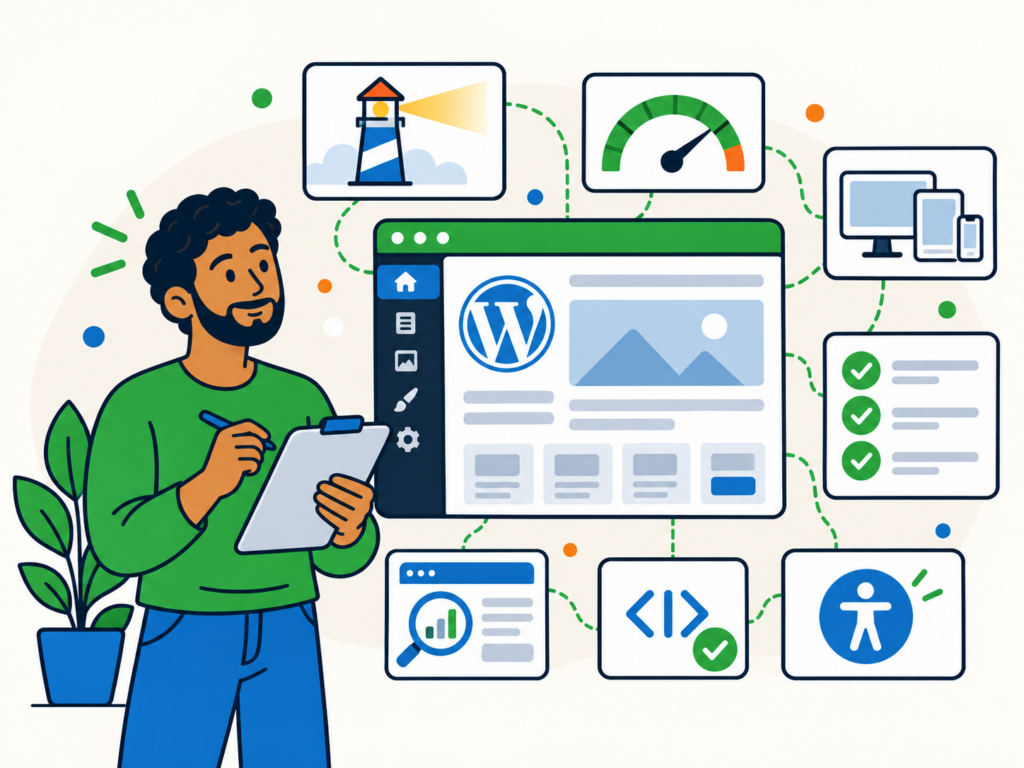
It loads a webpage under controlled conditions and runs a series of checks designed to identify potential problems with areas such as:
- Performance
- Accessibility
- Browser and development best practices
- Basic technical SEO
The exact audits and report structure can change as Lighthouse develops, so it is better to think of Lighthouse as an evolving diagnostic tool rather than a fixed checklist.
Lighthouse tests one page at a time. It does not perform a complete crawl of your WordPress website, and it cannot tell you everything about your users, SEO, accessibility or overall site health.
Its main value is showing you where a particular page may have problems that deserve closer investigation.
Lighthouse vs PageSpeed Insights
Lighthouse and Google PageSpeed Insights are closely related, but they are not the same thing.
Lighthouse performs controlled laboratory testing. It loads the page in a simulated environment so the same types of measurements can be collected during each test.
PageSpeed Insights uses Lighthouse for its laboratory analysis, but it may also show real-user data from the Chrome User Experience Report, commonly known as CrUX.
That distinction matters.
Lab data
Lab data comes from a controlled test.
It is useful for:
- Diagnosing specific problems
- Comparing changes before and after development work
- Reproducing tests under similar conditions
- Seeing detailed recommendations and diagnostics
Field data
Field data measures what real Chrome users have experienced over time.
It can reflect differences in:
- Devices
- Network connections
- Locations
- Browsers
- User behaviour
- Server conditions
A page can perform well in a Lighthouse test while some real visitors still have a poor experience. The reverse can also happen.
For a broader explanation of lab data, field data and performance-testing tools, see our website performance testing guide.
How to Run Google Lighthouse
For most WordPress site owners, Chrome DevTools is one of the easiest ways to run Lighthouse directly.
The exact wording and layout can change between Chrome versions, but the general process is straightforward.
- Open the page you want to test in Google Chrome.
- Open Chrome DevTools by right-clicking the page and selecting Inspect, or use the relevant keyboard shortcut for your operating system.
- Open the Lighthouse panel.
- Choose the available test settings you want to use, such as mobile or desktop.
- Select the audit categories you want to include.
- Start the analysis.
- Wait for Lighthouse to reload and test the page.
It is normally best to leave the page alone while the test is running.
You can also use PageSpeed Insights if you want a simple web-based test without opening DevTools.
Developers can run Lighthouse through command-line tools or automated testing systems such as Lighthouse CI, but most WordPress site owners do not need those methods for routine checks.
Which Pages Should You Test?
Testing only your homepage gives you a very limited picture of your website.
Different WordPress page types can use different templates, plugins, scripts and content.
A useful test set might include:
- Homepage
- Important service page
- Blog article
- Product page
- Shop or category page
- Contact page
- Landing page
- Checkout or other important conversion page
Choose pages that represent the parts of the website your visitors actually use.
If you run an online shop, for example, a fast homepage does not tell you whether an individual product page is performing well.
Likewise, an article containing a few images may behave very differently from a page containing sliders, forms, maps, embedded video or third-party tracking scripts.
Test Mobile and Desktop Separately
Do not assume that a page which performs well on desktop will perform equally well on mobile.
Mobile devices can have:
- Less processing power
- Slower network connections
- Smaller screens
- Different interaction patterns
Lighthouse can test pages under different simulated conditions, which makes mobile testing especially useful for exposing problems that may be less obvious on a fast desktop computer.
You should treat mobile and desktop results as separate measurements rather than expecting identical scores.
How to Read a Lighthouse Report
The first thing most people notice is the set of coloured scores near the top of the report.
Those scores are useful summaries, but they should not be treated as the objective of the audit.
A Lighthouse report normally contains a mixture of:
- Category scores
- Individual audits
- Performance metrics
- Diagnostics
- Recommendations or insights
- Passed checks
- Items requiring manual review
The exact organisation changes as Lighthouse evolves.
Instead of asking, “How do I get this score to 100?”, ask:
What is this report telling me about the experience of someone using this page?
That question usually leads to better decisions.
Understanding the Lighthouse Performance Score
The Performance score combines several measurements rather than representing a single page-load time.
Current Lighthouse performance scoring uses metrics including:
First Contentful Paint
First Contentful Paint, or FCP, measures how quickly the browser displays the first piece of page content.
That could be text, an image or another visible element.
A slow FCP can make a page feel unresponsive because visitors are left looking at a blank screen for too long.
Speed Index
Speed Index measures how quickly the visible parts of the page are populated during loading.
It is concerned with how fast the page appears to become visually complete.
Largest Contentful Paint
Largest Contentful Paint, or LCP, measures how long it takes for the largest significant piece of visible content to appear.
On a WordPress website, this might be:
- A hero image
- A featured image
- A large heading
- A prominent block of text
LCP is also one of Google’s Core Web Vitals.
Total Blocking Time
Total Blocking Time, or TBT, measures how much time the main browser thread is blocked by long tasks during page loading.
Heavy JavaScript is a common reason for high blocking time.
A page can appear to have loaded but still feel sluggish if the browser is busy processing scripts instead of responding quickly to user input.
Cumulative Layout Shift
Cumulative Layout Shift, or CLS, measures unexpected movement of visible content while the page is loading.
Examples include:
- Text shifting when a font loads
- Images pushing content down because dimensions were not reserved
- Cookie banners changing the layout
- Advertisements appearing late
- Widgets inserting themselves above existing content
CLS is another Core Web Vital.
The Performance Score Is Weighted
The overall Performance score is not a simple average of the individual metrics.
Some measurements influence the score more heavily than others.
This is one reason why fixing a seemingly small issue can sometimes change the score significantly while resolving several minor recommendations barely moves it.
It is also why you should not work through every Lighthouse recommendation in order purely because it appears in the report.
Look at the underlying problem and its likely effect on visitors.
Lighthouse and Core Web Vitals Are Not the Same Thing
It is easy to confuse Lighthouse metrics with Core Web Vitals because there is some overlap.
The current Core Web Vitals are:
- Largest Contentful Paint
- Interaction to Next Paint
- Cumulative Layout Shift
Lighthouse measures LCP and CLS directly during its lab test.
Interaction to Next Paint, or INP, is different because it is based on real user interactions over time. A synthetic Lighthouse page-load test cannot reproduce a site’s complete history of real visitor interactions.
Lighthouse therefore uses laboratory diagnostics such as Total Blocking Time to help identify responsiveness problems that may contribute to poor interaction performance.
If field data is available in PageSpeed Insights, use that alongside Lighthouse rather than assuming the Lighthouse score tells you how every real visitor experiences the page.
Understanding Accessibility Results
The Accessibility section checks for issues that automated testing can identify.
Examples can include problems with:
- Colour contrast
- Form labels
- Image alternative text
- Heading structure
- Accessible names
- Document language
- Links and buttons
- ARIA implementation
These checks are useful because accessibility problems can easily go unnoticed during visual testing.
However, automated testing cannot determine whether a website is fully accessible.
Some issues require a person to check things such as:
- Whether the page makes sense when navigating by keyboard
- Whether focus order is logical
- Whether content is understandable
- Whether alternative text is genuinely useful
- Whether interactive elements behave correctly with assistive technology
A score of 100 therefore does not prove that a page is completely accessible.
Treat the Lighthouse accessibility report as a useful first layer of testing, not a replacement for proper accessibility review.
Understanding Best Practices
The Best Practices section checks a range of technical and browser-related issues.
These can include problems involving:
- Browser security
- Deprecated technologies
- JavaScript errors
- Image display
- HTTPS
- Browser APIs
- Other implementation issues
This part of the report is particularly useful for finding technical problems that may not be obvious from simply looking at the page.
Do not assume every failed Best Practices audit has the same importance.
A security-related problem may deserve immediate attention, while another warning may have little practical effect on your particular website.
Read what Lighthouse is actually reporting before deciding what to change.
Understanding Lighthouse SEO Results
Lighthouse also performs a selection of basic SEO checks.
These are useful for identifying certain technical mistakes, such as problems that could make a page more difficult for search engines to discover or understand.
Depending on the Lighthouse version, checks may cover areas such as:
- Page titles
- Meta descriptions
- Crawlability
- Indexing restrictions
- HTTP status
- Links
- Canonical implementation
- Mobile usability
This is useful, but it is not a complete SEO audit.
Lighthouse does not replace work involving:
- Keyword research
- Search intent
- Content quality
- Internal-link strategy
- Backlinks
- Competitor research
- Site architecture
- Full technical crawling
- Search performance analysis
A Lighthouse SEO score of 100 therefore does not mean that a page will rank well in Google.
It simply means the page passed the automated SEO checks included in that Lighthouse test.
Why Lighthouse Scores Change Between Tests
You may run Lighthouse twice on the same page and get different results.
That does not necessarily mean anything is broken.
Performance can vary because of factors such as:
- Server response time
- Network conditions
- Background processes on your computer
- Browser state
- Third-party scripts
- Analytics
- Advertising
- A/B testing
- External fonts
- Embedded media
- Caching
- Dynamic content
Some WordPress websites also generate different output depending on cookies, login status, personalisation or caching layers.
For this reason, avoid judging a website from a single test.
Run several comparable tests and look for a pattern.
If you are comparing a before and after result, keep the conditions as similar as possible.
Do Not Chase a Perfect Lighthouse Score
A score of 100 can look satisfying, but it is not the same thing as having a successful website.
A useful feature may slightly reduce a Lighthouse score while providing genuine value to visitors.
Examples might include:
- Live chat
- Payment functionality
- Analytics
- Video
- Booking tools
- Interactive maps
- Marketing integrations
That does not mean every third-party script is justified, but removing useful functionality just to increase a score can be counterproductive.
The aim should be a website that is fast, usable, accessible and effective for real visitors.
Use Lighthouse as evidence when making decisions, not as a game where the only goal is turning every number green.
How to Prioritise Lighthouse Recommendations
A long Lighthouse report can be intimidating, especially if several sections contain warnings.
Do not try to fix everything at once.
A better approach is to work through the findings systematically.
1. Look for problems that affect real users
Start with issues that are likely to make the page noticeably slower, harder to use or inaccessible.
For example, a very slow main image or heavy JavaScript may deserve more attention than a minor diagnostic with little practical effect.
2. Look for repeated problems
If the same issue appears across several important pages, fixing the underlying cause may improve a large part of the website.
A WordPress theme, plugin or global script can affect hundreds of pages at once.
3. Check what is causing the problem
Lighthouse identifies symptoms and provides diagnostic information, but the fix depends on your website.
A large LCP element, for example, could be caused by:
- An oversized image
- Slow hosting
- Render-blocking CSS
- Delayed font loading
- JavaScript
- A page builder
- A third-party service
Do not apply a generic fix until you understand the cause.
4. Consider the trade-offs
Some recommendations involve functionality as well as performance.
Before removing a script or plugin, find out what it does and whether the website depends on it.
The fastest website is not necessarily the most useful website.
5. Change one thing at a time
If possible, make one meaningful change and then retest.
Changing several plugins, scripts and settings simultaneously makes it difficult to know which change helped or caused a new problem.
6. Compare repeated tests
Run Lighthouse again under comparable conditions.
Look for consistent improvement rather than relying on a single unusually good or bad result.
Common WordPress Issues Lighthouse Can Expose
Lighthouse does not diagnose WordPress specifically, but its findings often reveal common WordPress problems.
These can include:
- Oversized images
- Excessive JavaScript
- Slow third-party scripts
- Render-blocking resources
- Layout shifts
- Heavy web fonts
- Slow server responses
- Poorly optimised themes
- Plugin-generated assets
- Accessibility problems
- Missing SEO basics
The correct solution depends on what is causing the problem.
If images are responsible for a large part of the page weight, our WordPress image optimisation guide explains how to improve them without simply deleting useful visual content.
For broader WordPress performance improvements, see our practical guide to speeding up WordPress.
Test Again After Making Changes
A Lighthouse audit is most useful when it forms part of a repeatable process.
A simple workflow is:
- Test the page.
- Record the important results.
- Identify one meaningful problem.
- Find the underlying cause.
- Make the change safely.
- Test the page again.
- Check that functionality still works.
- Compare the new result with the original baseline.
Where possible, make significant WordPress changes on a staging site before applying them to your live website.
Performance improvements should not come at the cost of broken forms, missing scripts, damaged layouts or other functionality.
A Practical Google Lighthouse Checklist
When using Lighthouse on your WordPress website:
- Test more than your homepage
- Test mobile and desktop separately
- Use representative pages
- Record your baseline before making changes
- Run more than one test
- Review individual audits, not just the headline score
- Distinguish lab results from real-user field data
- Pay attention to accessibility findings
- Treat SEO checks as basic technical checks, not a full SEO audit
- Prioritise issues with genuine user impact
- Investigate the underlying cause before applying a fix
- Avoid removing useful functionality purely to improve a score
- Make controlled changes
- Retest afterwards
- Check the website still works correctly
Use Lighthouse as a Diagnostic Tool
Google Lighthouse is valuable because it can quickly expose technical problems that are difficult to spot by looking at a webpage normally.
Its real usefulness does not come from achieving a perfect score. It comes from understanding why a page received its results and using that information to make sensible improvements.
Use Lighthouse alongside real-user data and broader website testing rather than relying on it in isolation.
If Lighthouse has uncovered performance or technical problems on your WordPress site and you are not sure how to resolve them safely, our one-off WordPress support service can help investigate and fix the underlying issue.